In math we have been learning about data management. In this unit, the children have been sorting, making bar graphs and pictographs, surveying our friends, tallying our survey results, and interpreting the data presented on graphs.
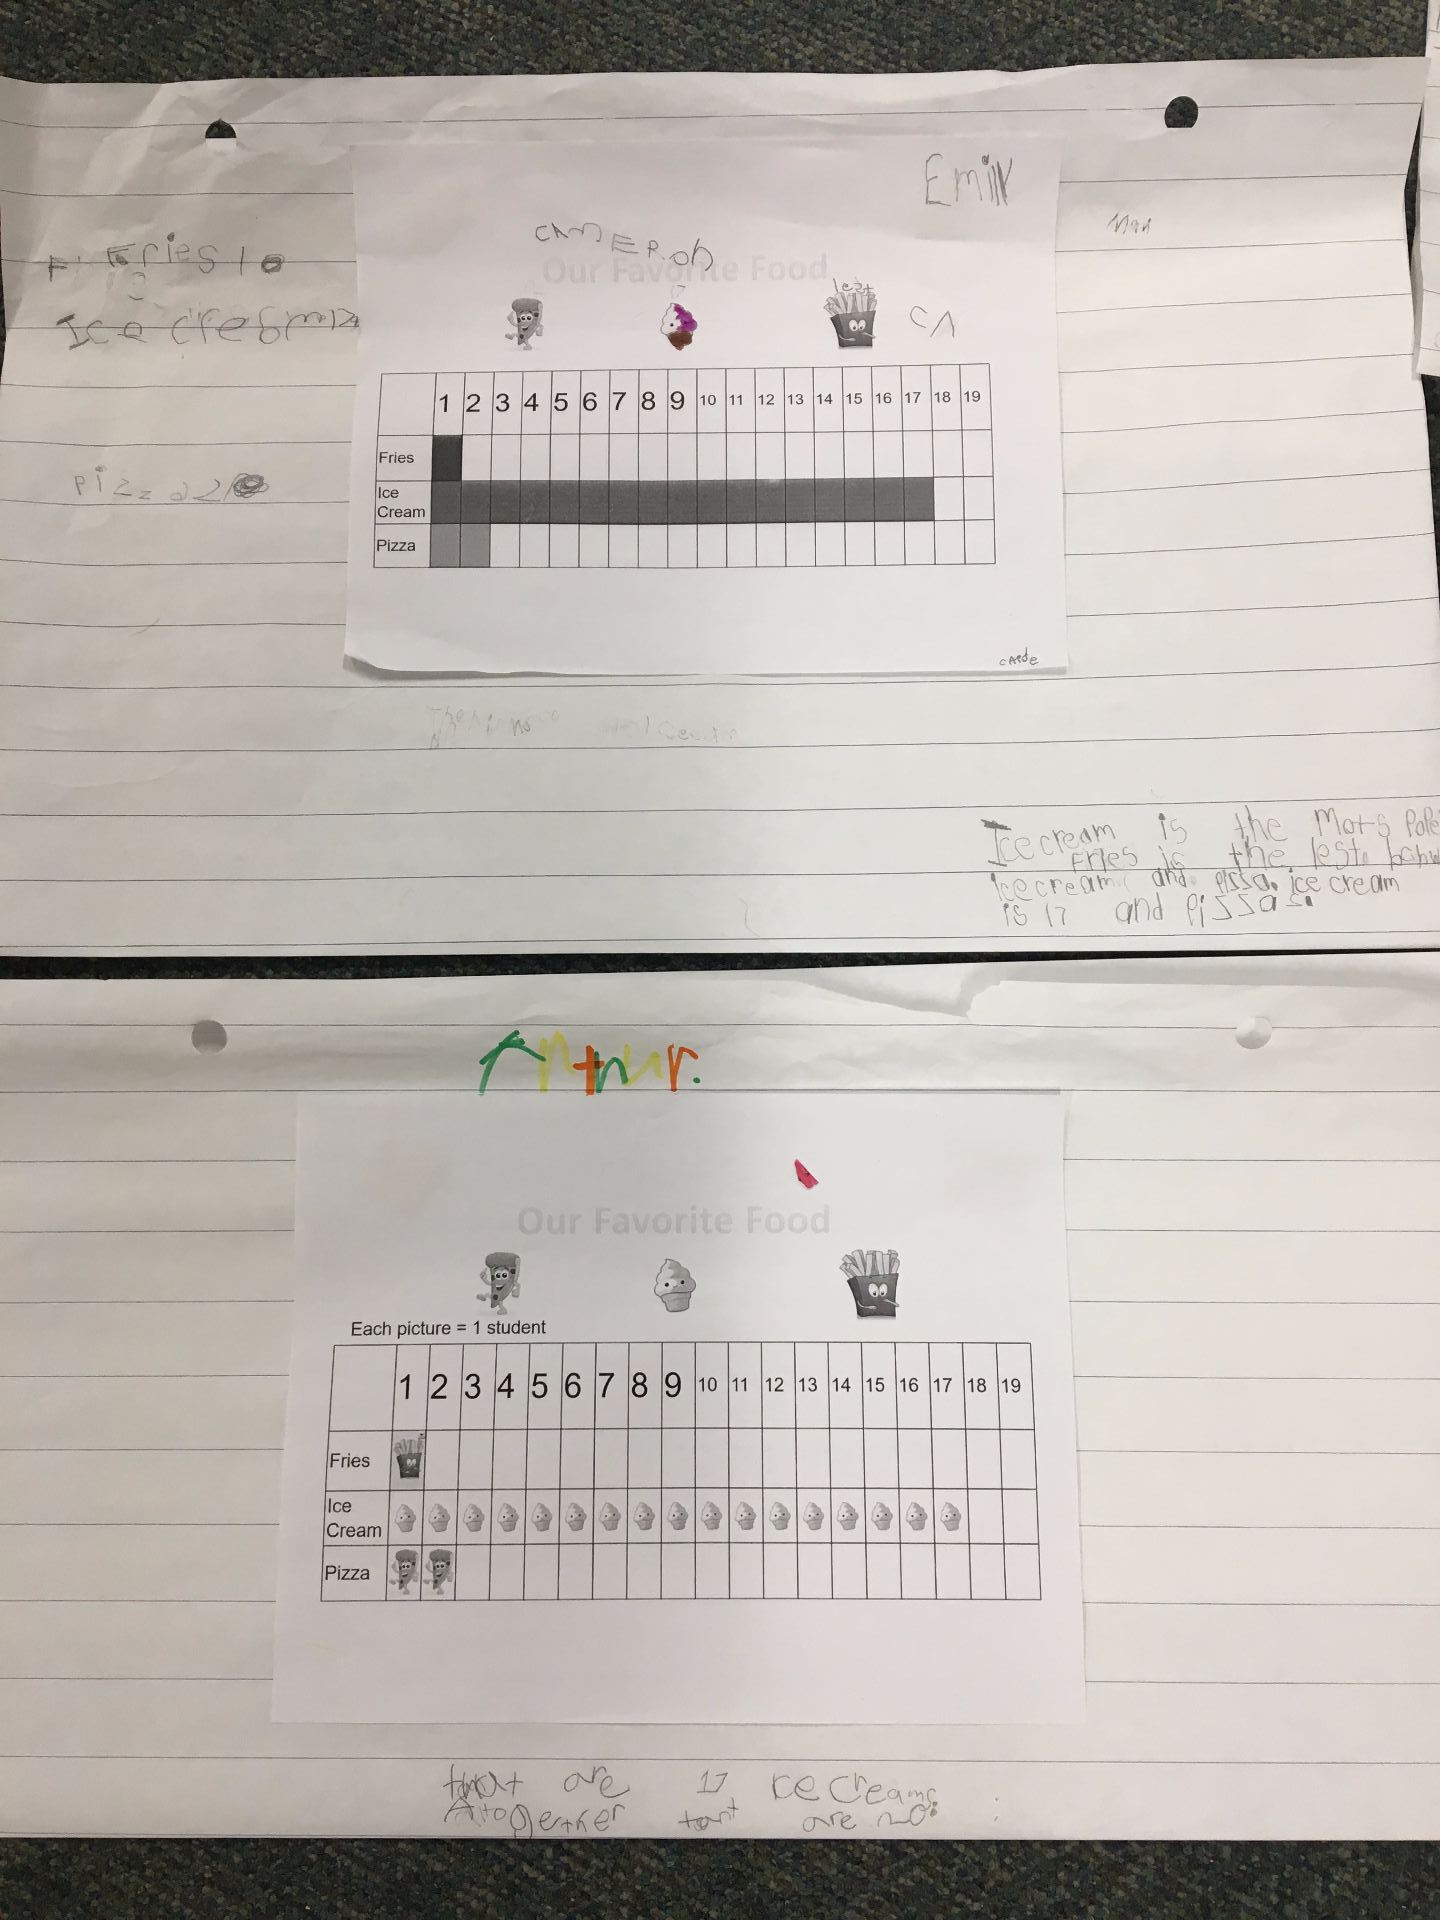
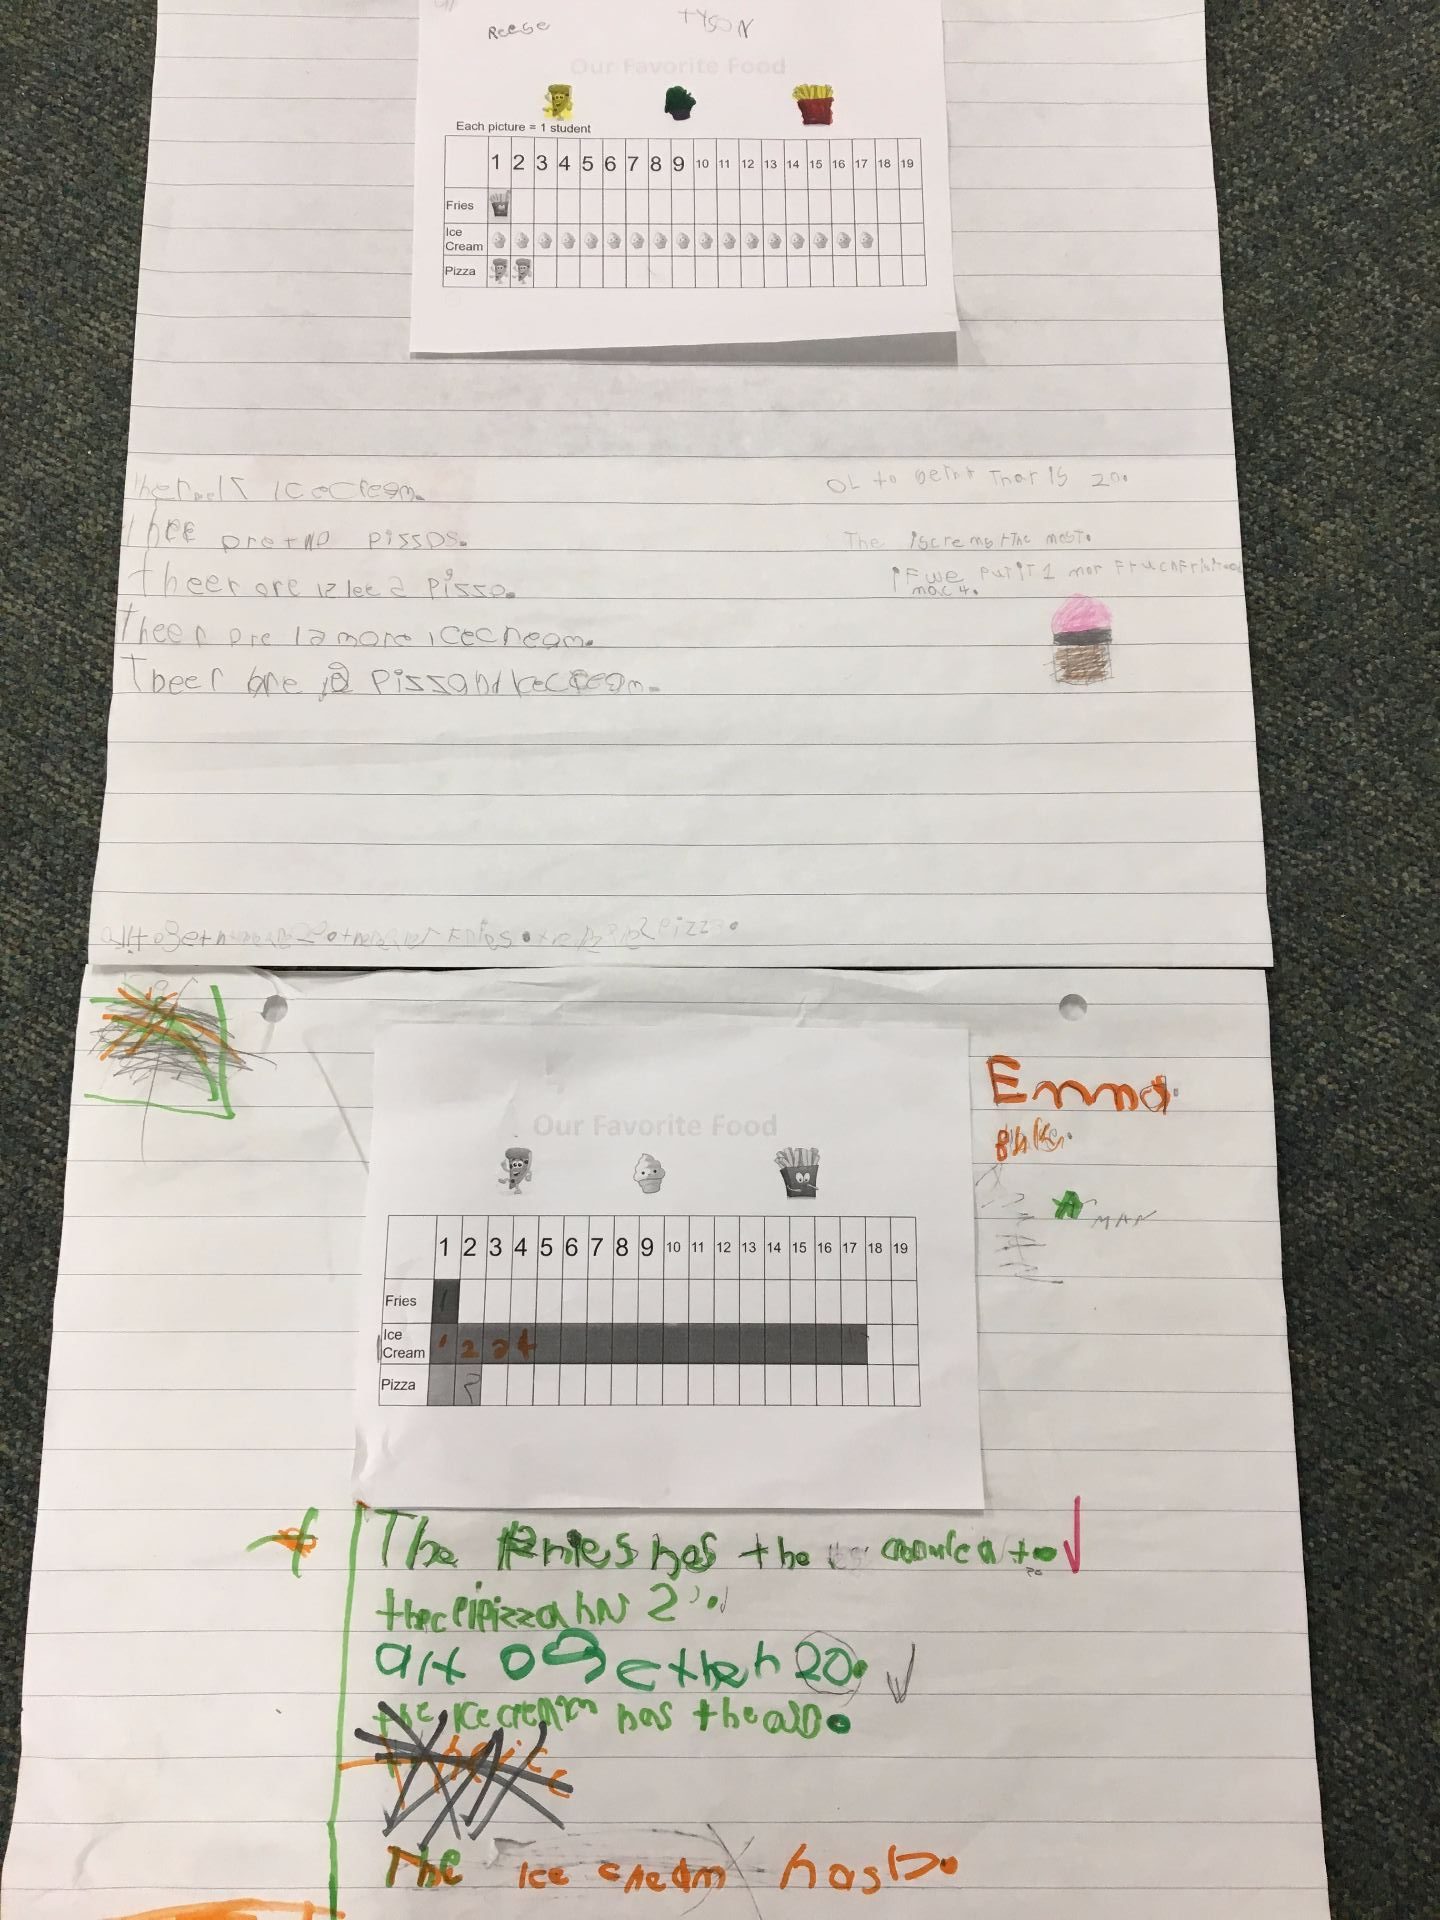
The children seem to be really enjoying this unit and are doing an excellent job. Yesterday they worked in small groups to describe the data they saw in either a pictograph or bar graphs.
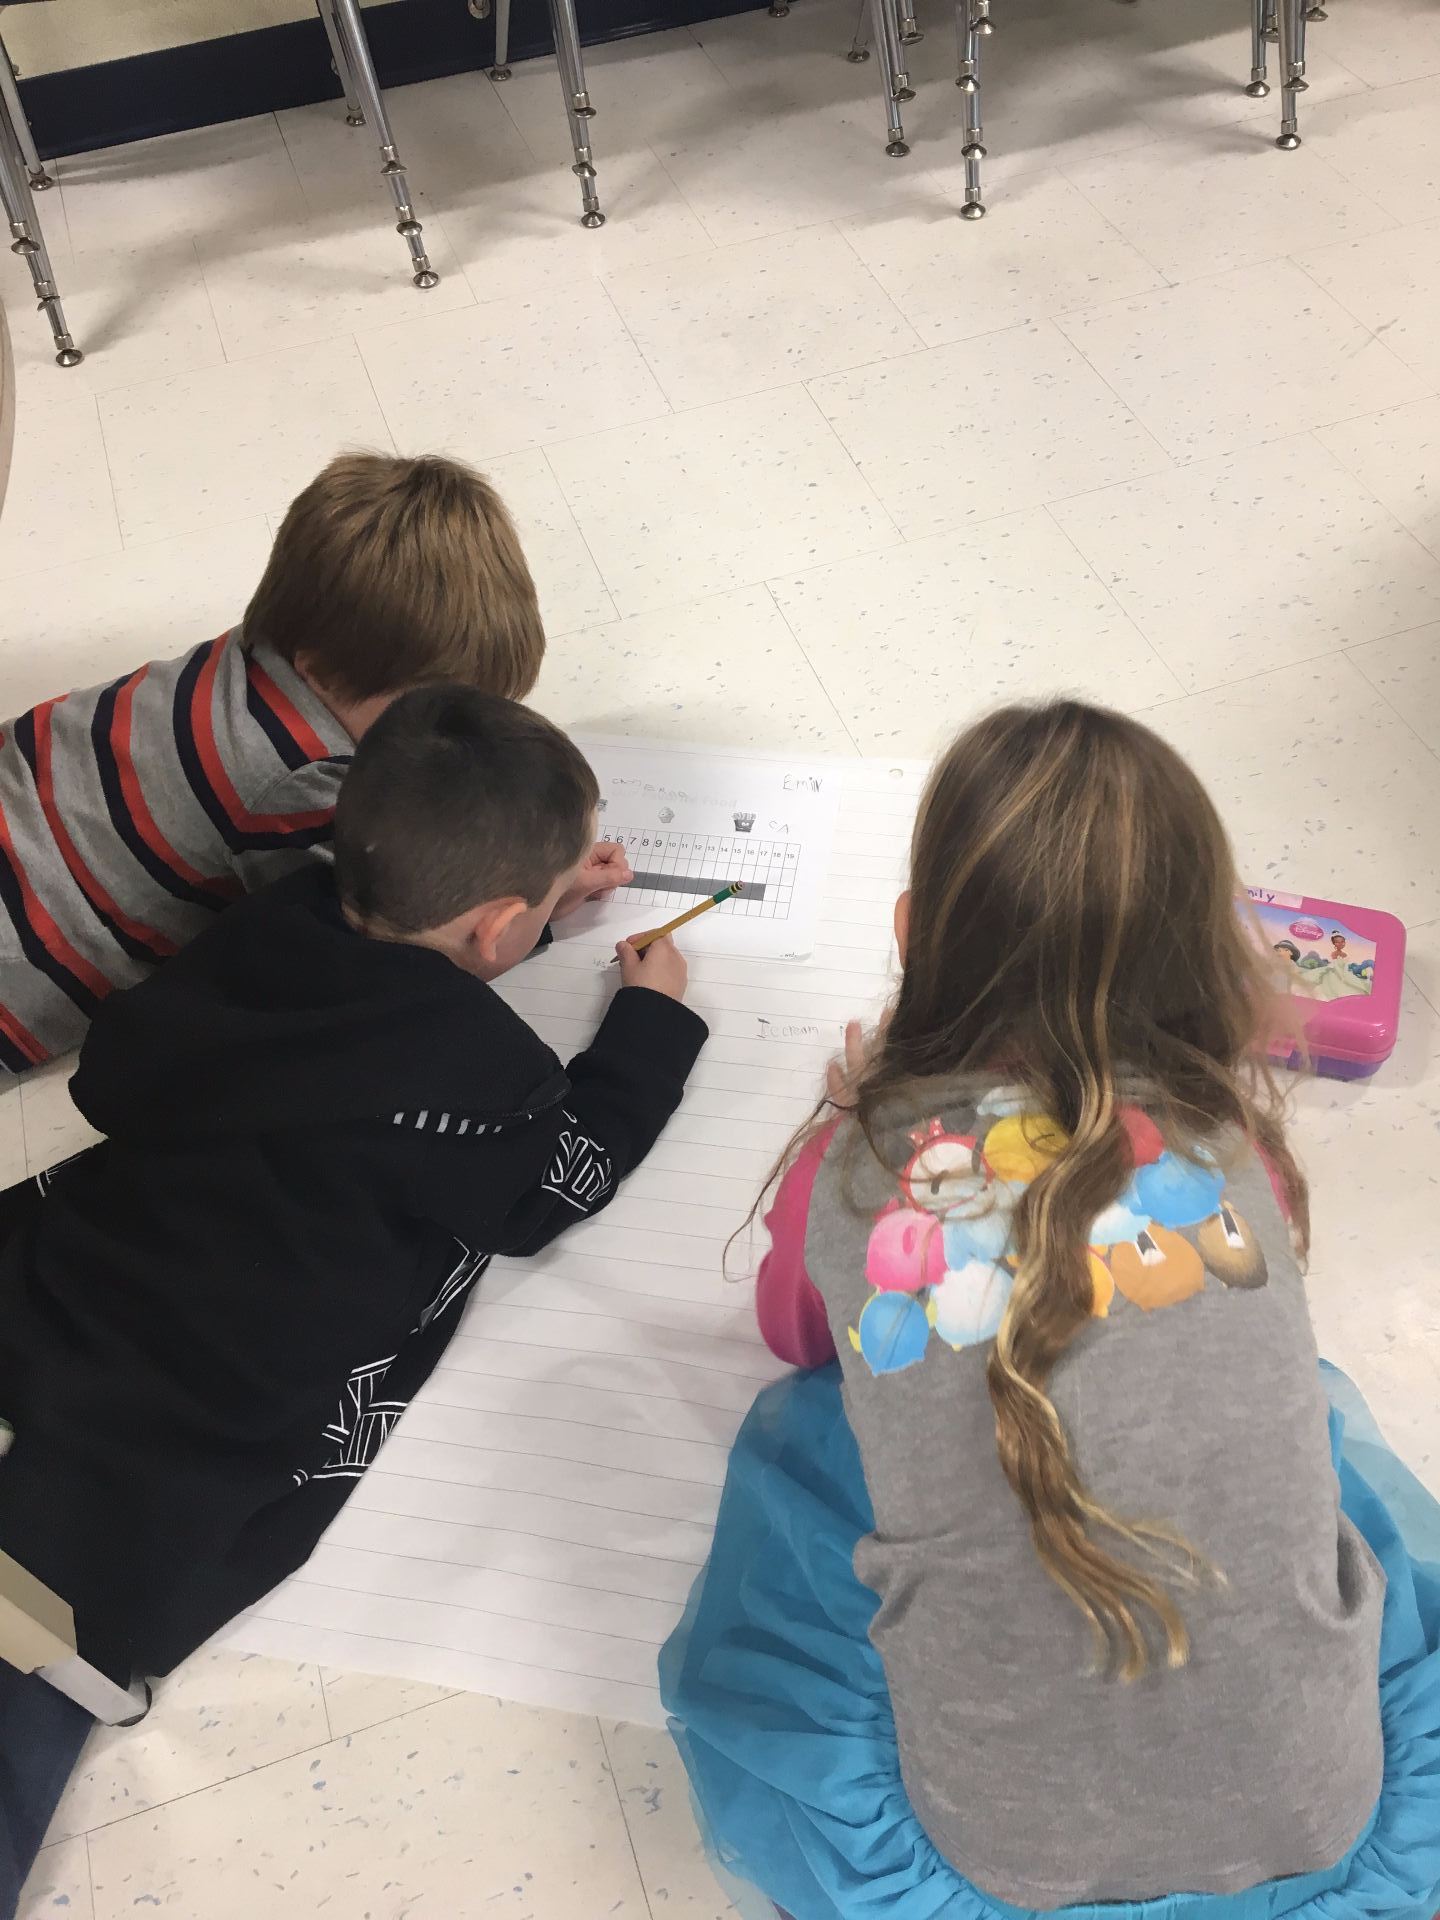
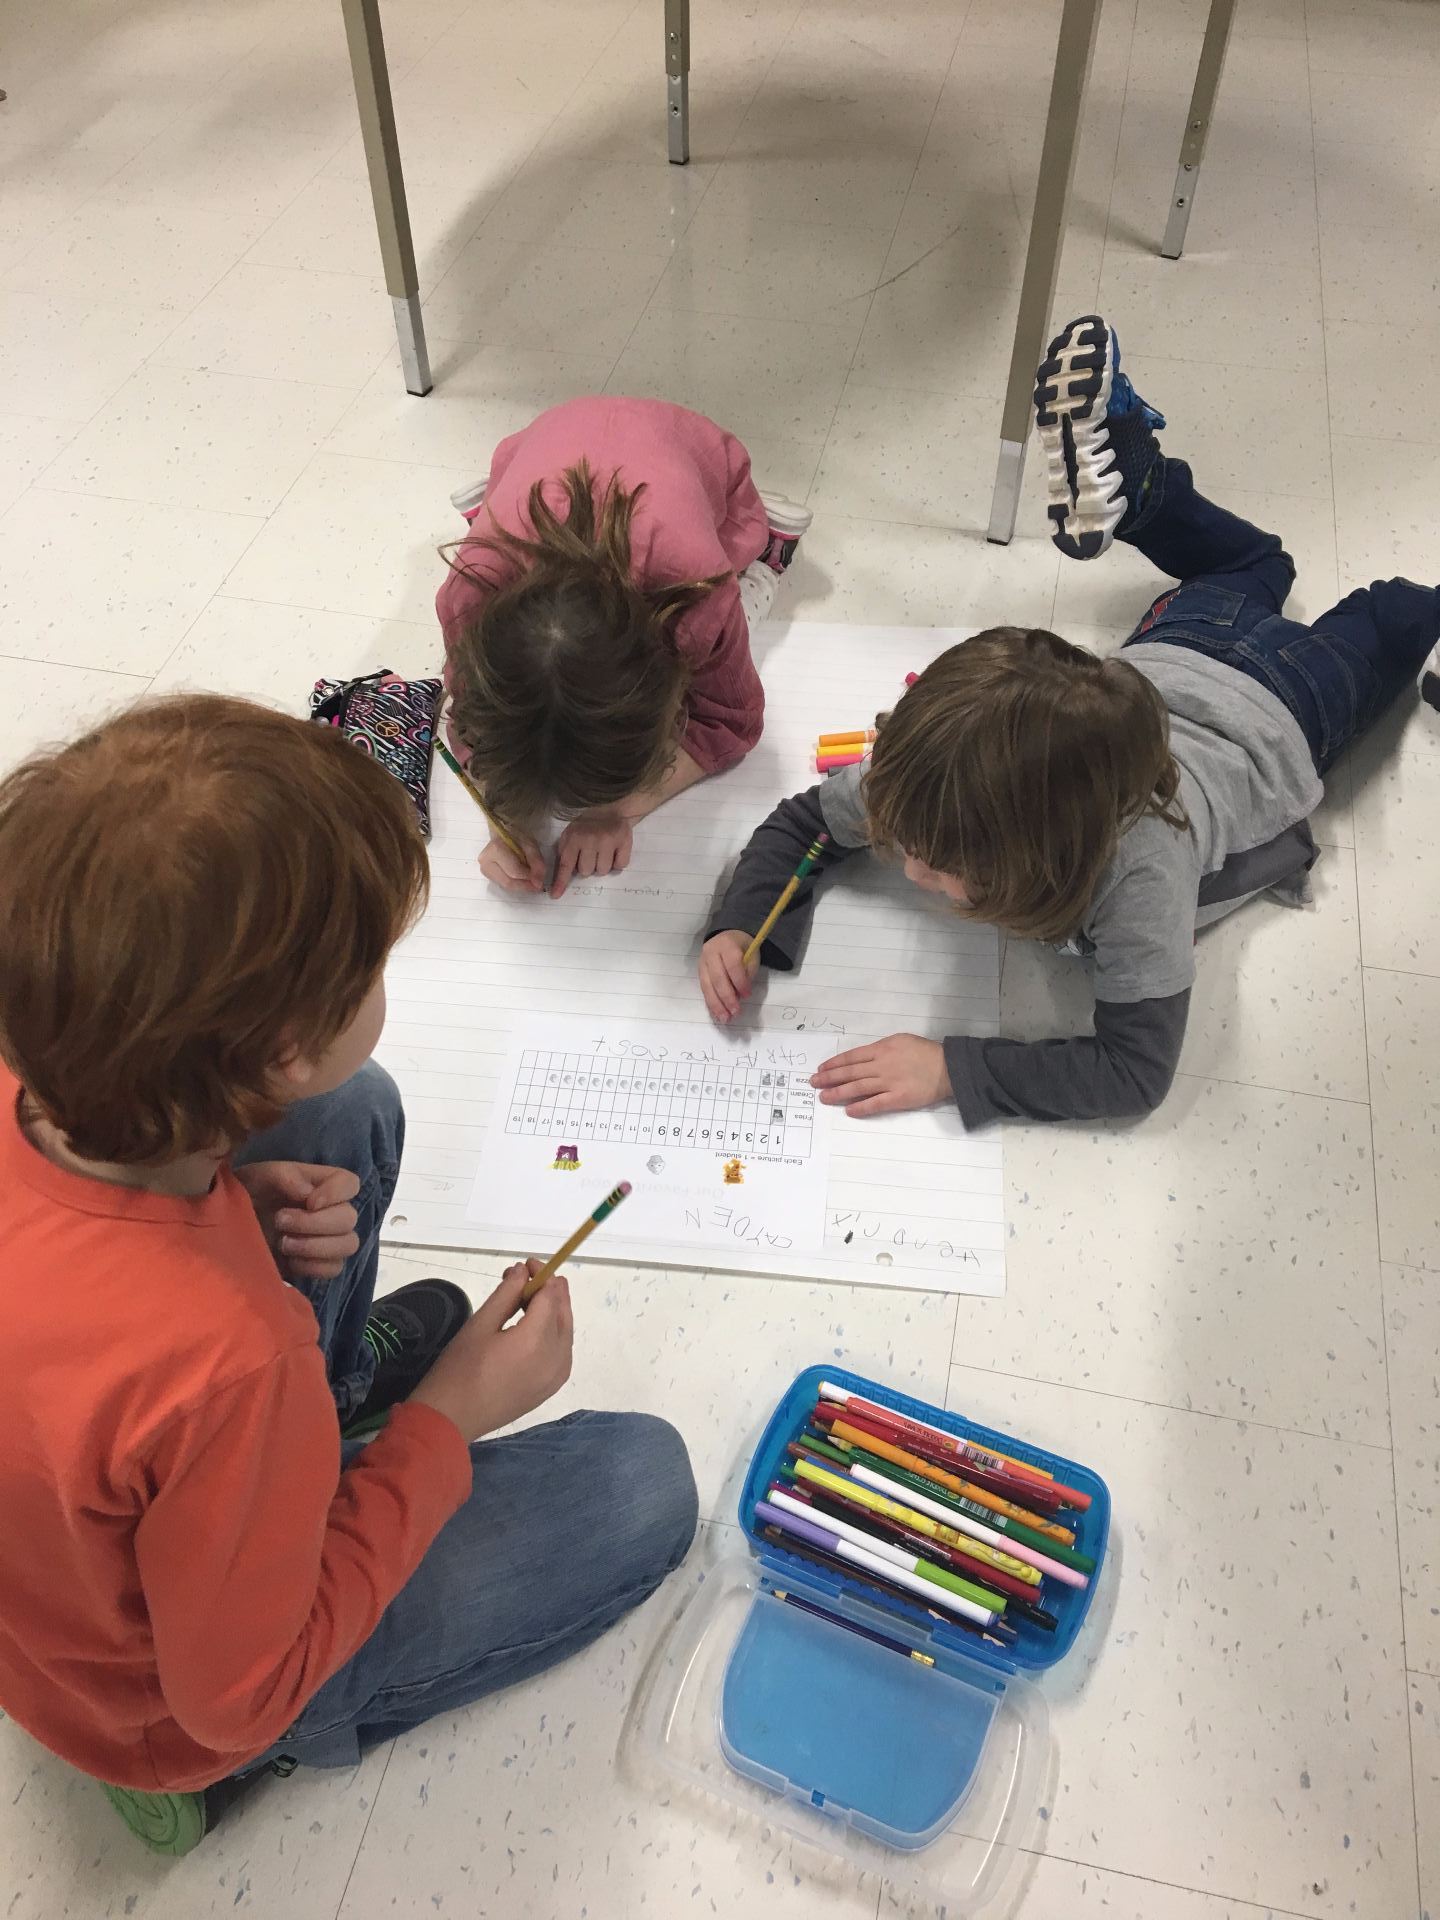


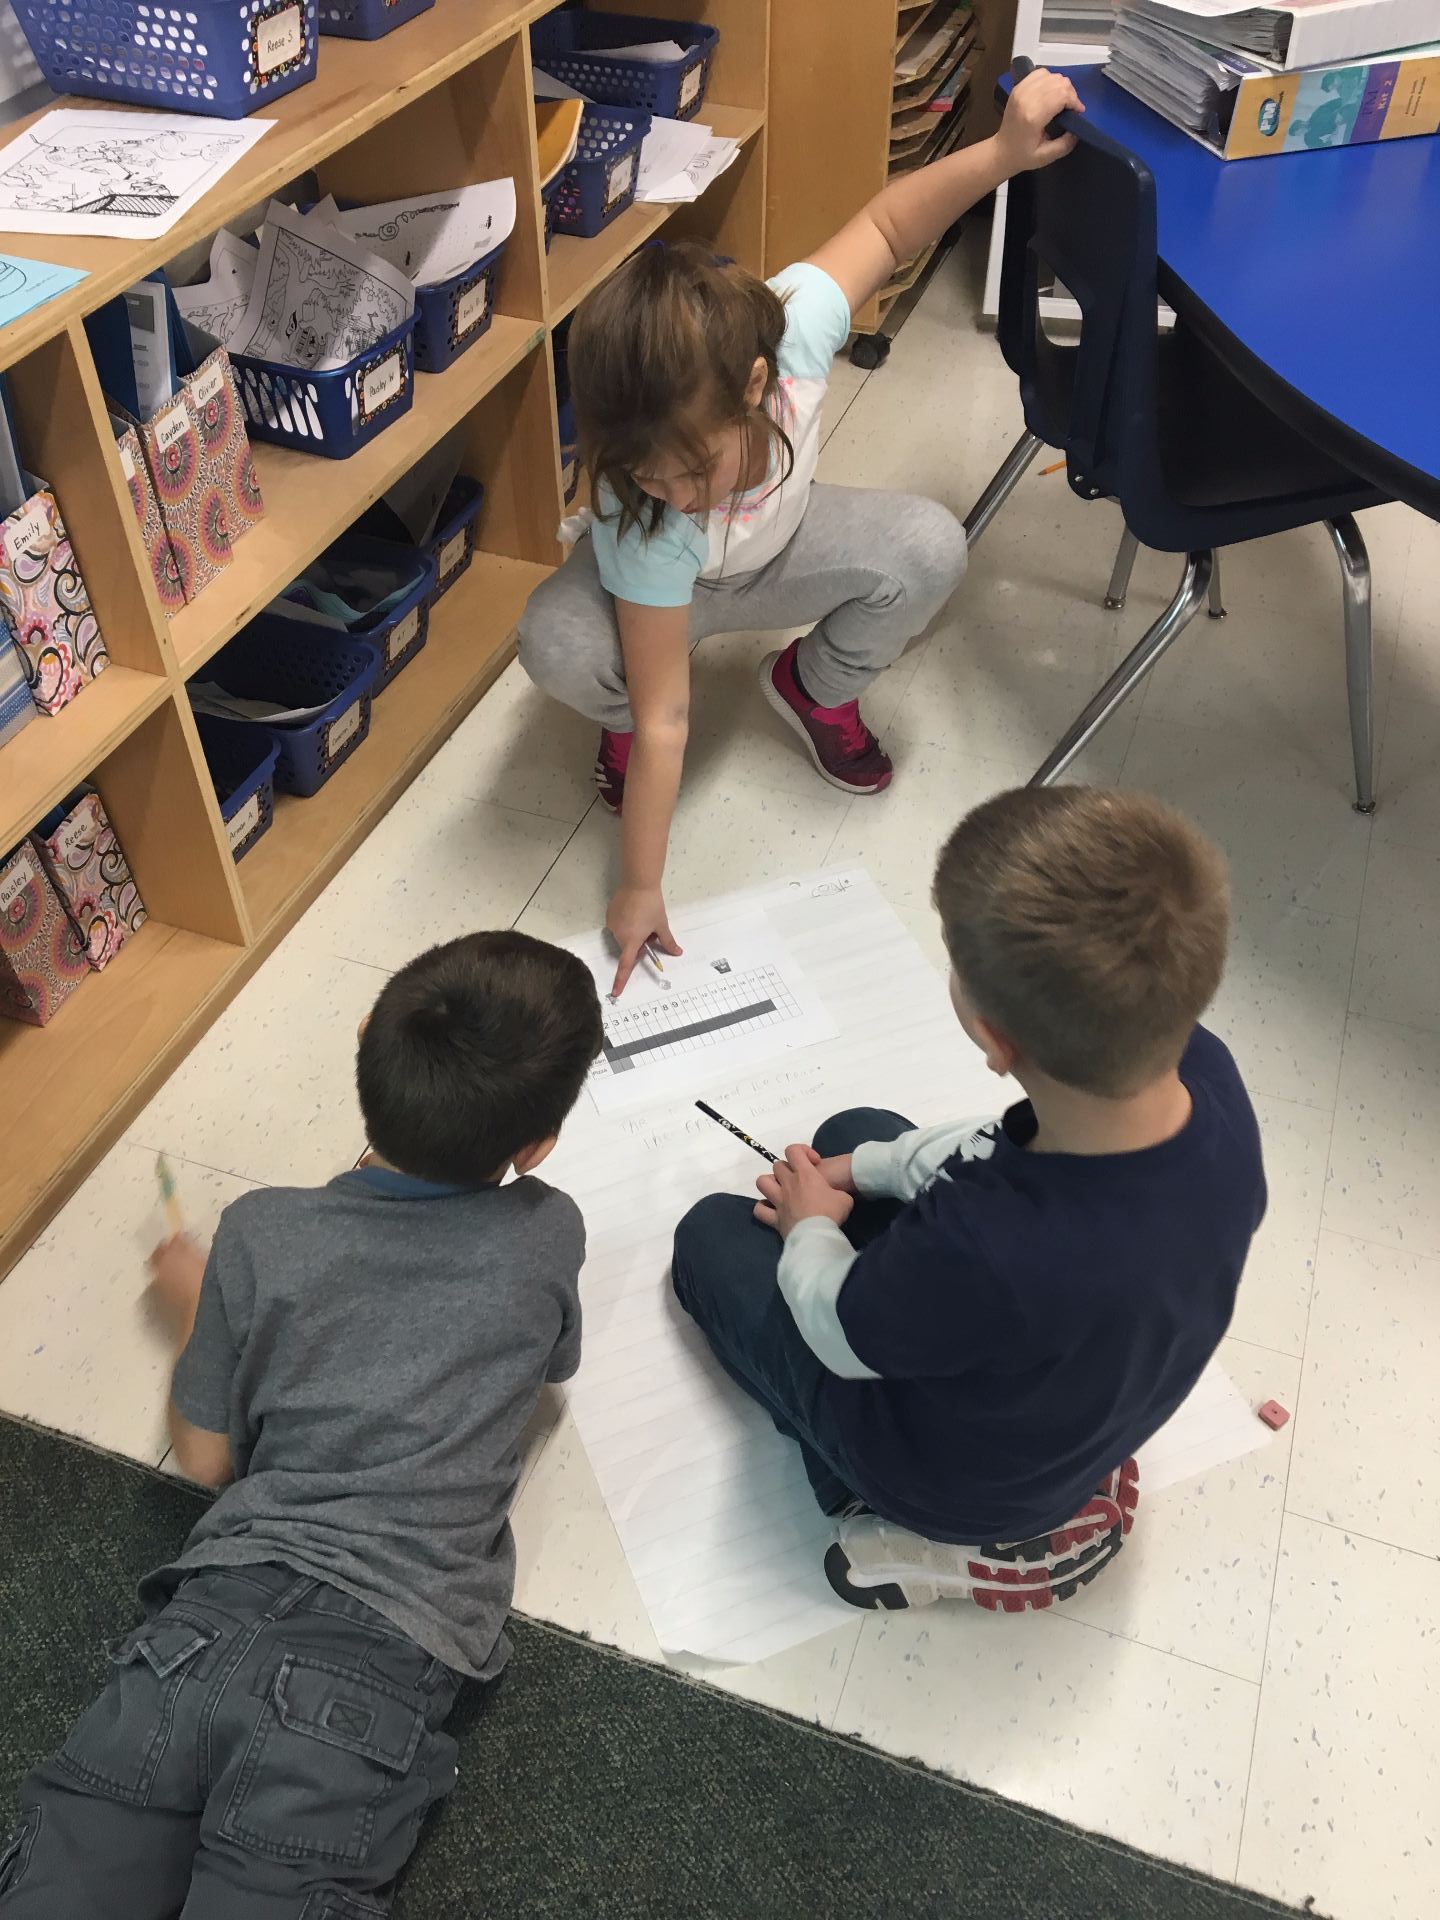
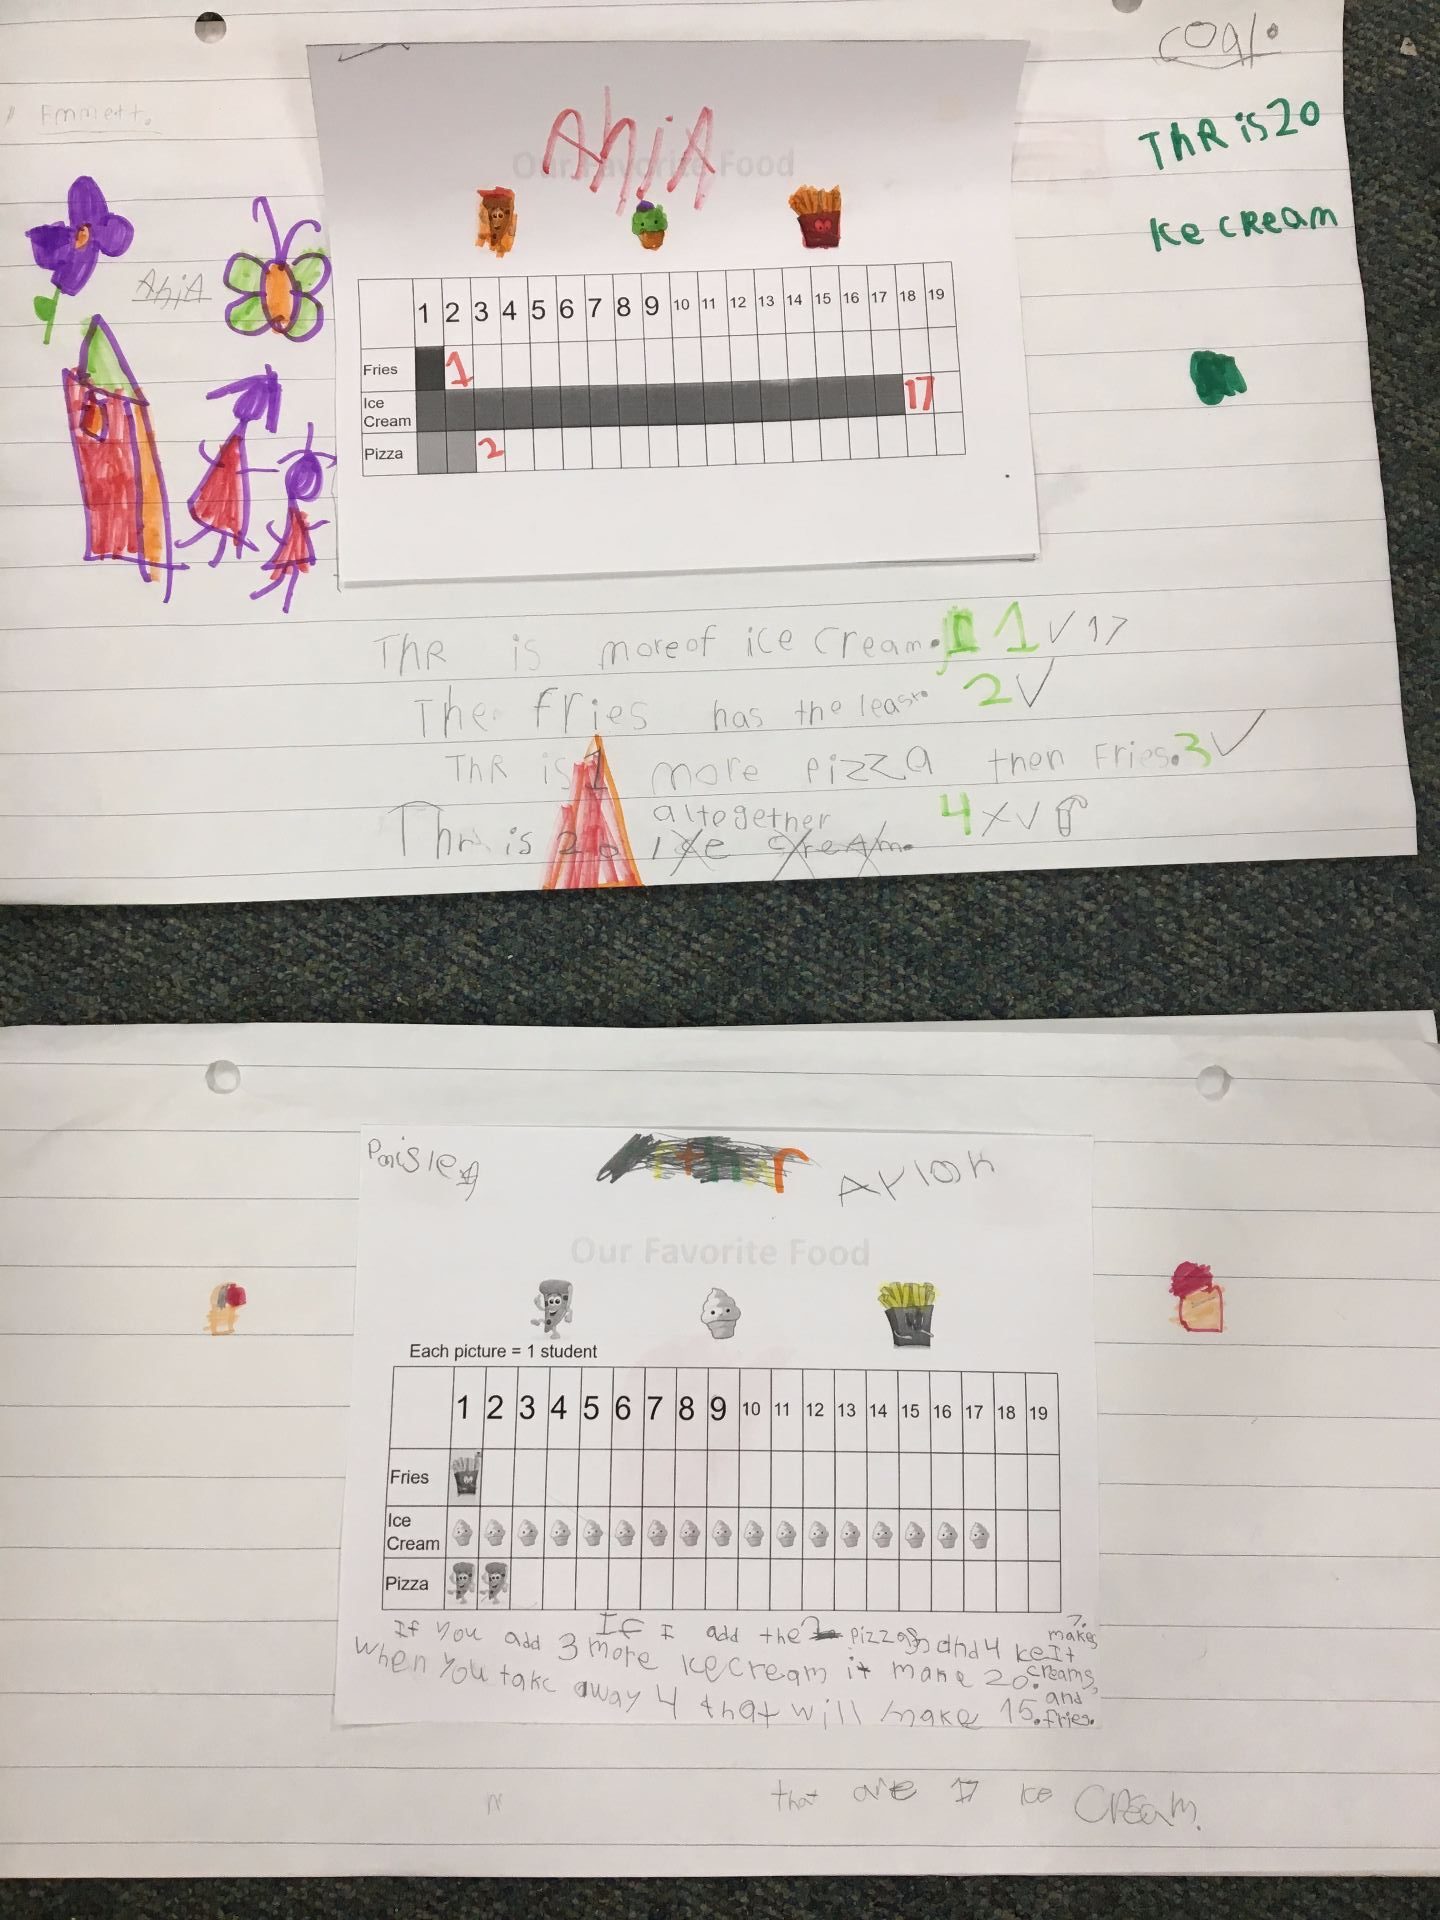
As part of describing the information found in graphs, we are working hard to not only state the basic data (e.g. 1 person likes pizza), but to make some comparisons (e.g. 17 more people like ice cream than french fries or Altogether 19 people were surveyed).

Today each child created their own survey question and got to ask 10 of their peers. Following the completion of their survey, the students created a graph of their data.

